


The US stock market seems to be recovering on February 24, 2026, after Monday’s sharp selloff driven by AI disruption fears and tariff chaos. The S&P 500 is trading around 6,890 at press time, up approximately 0.7% from Monday’s close.
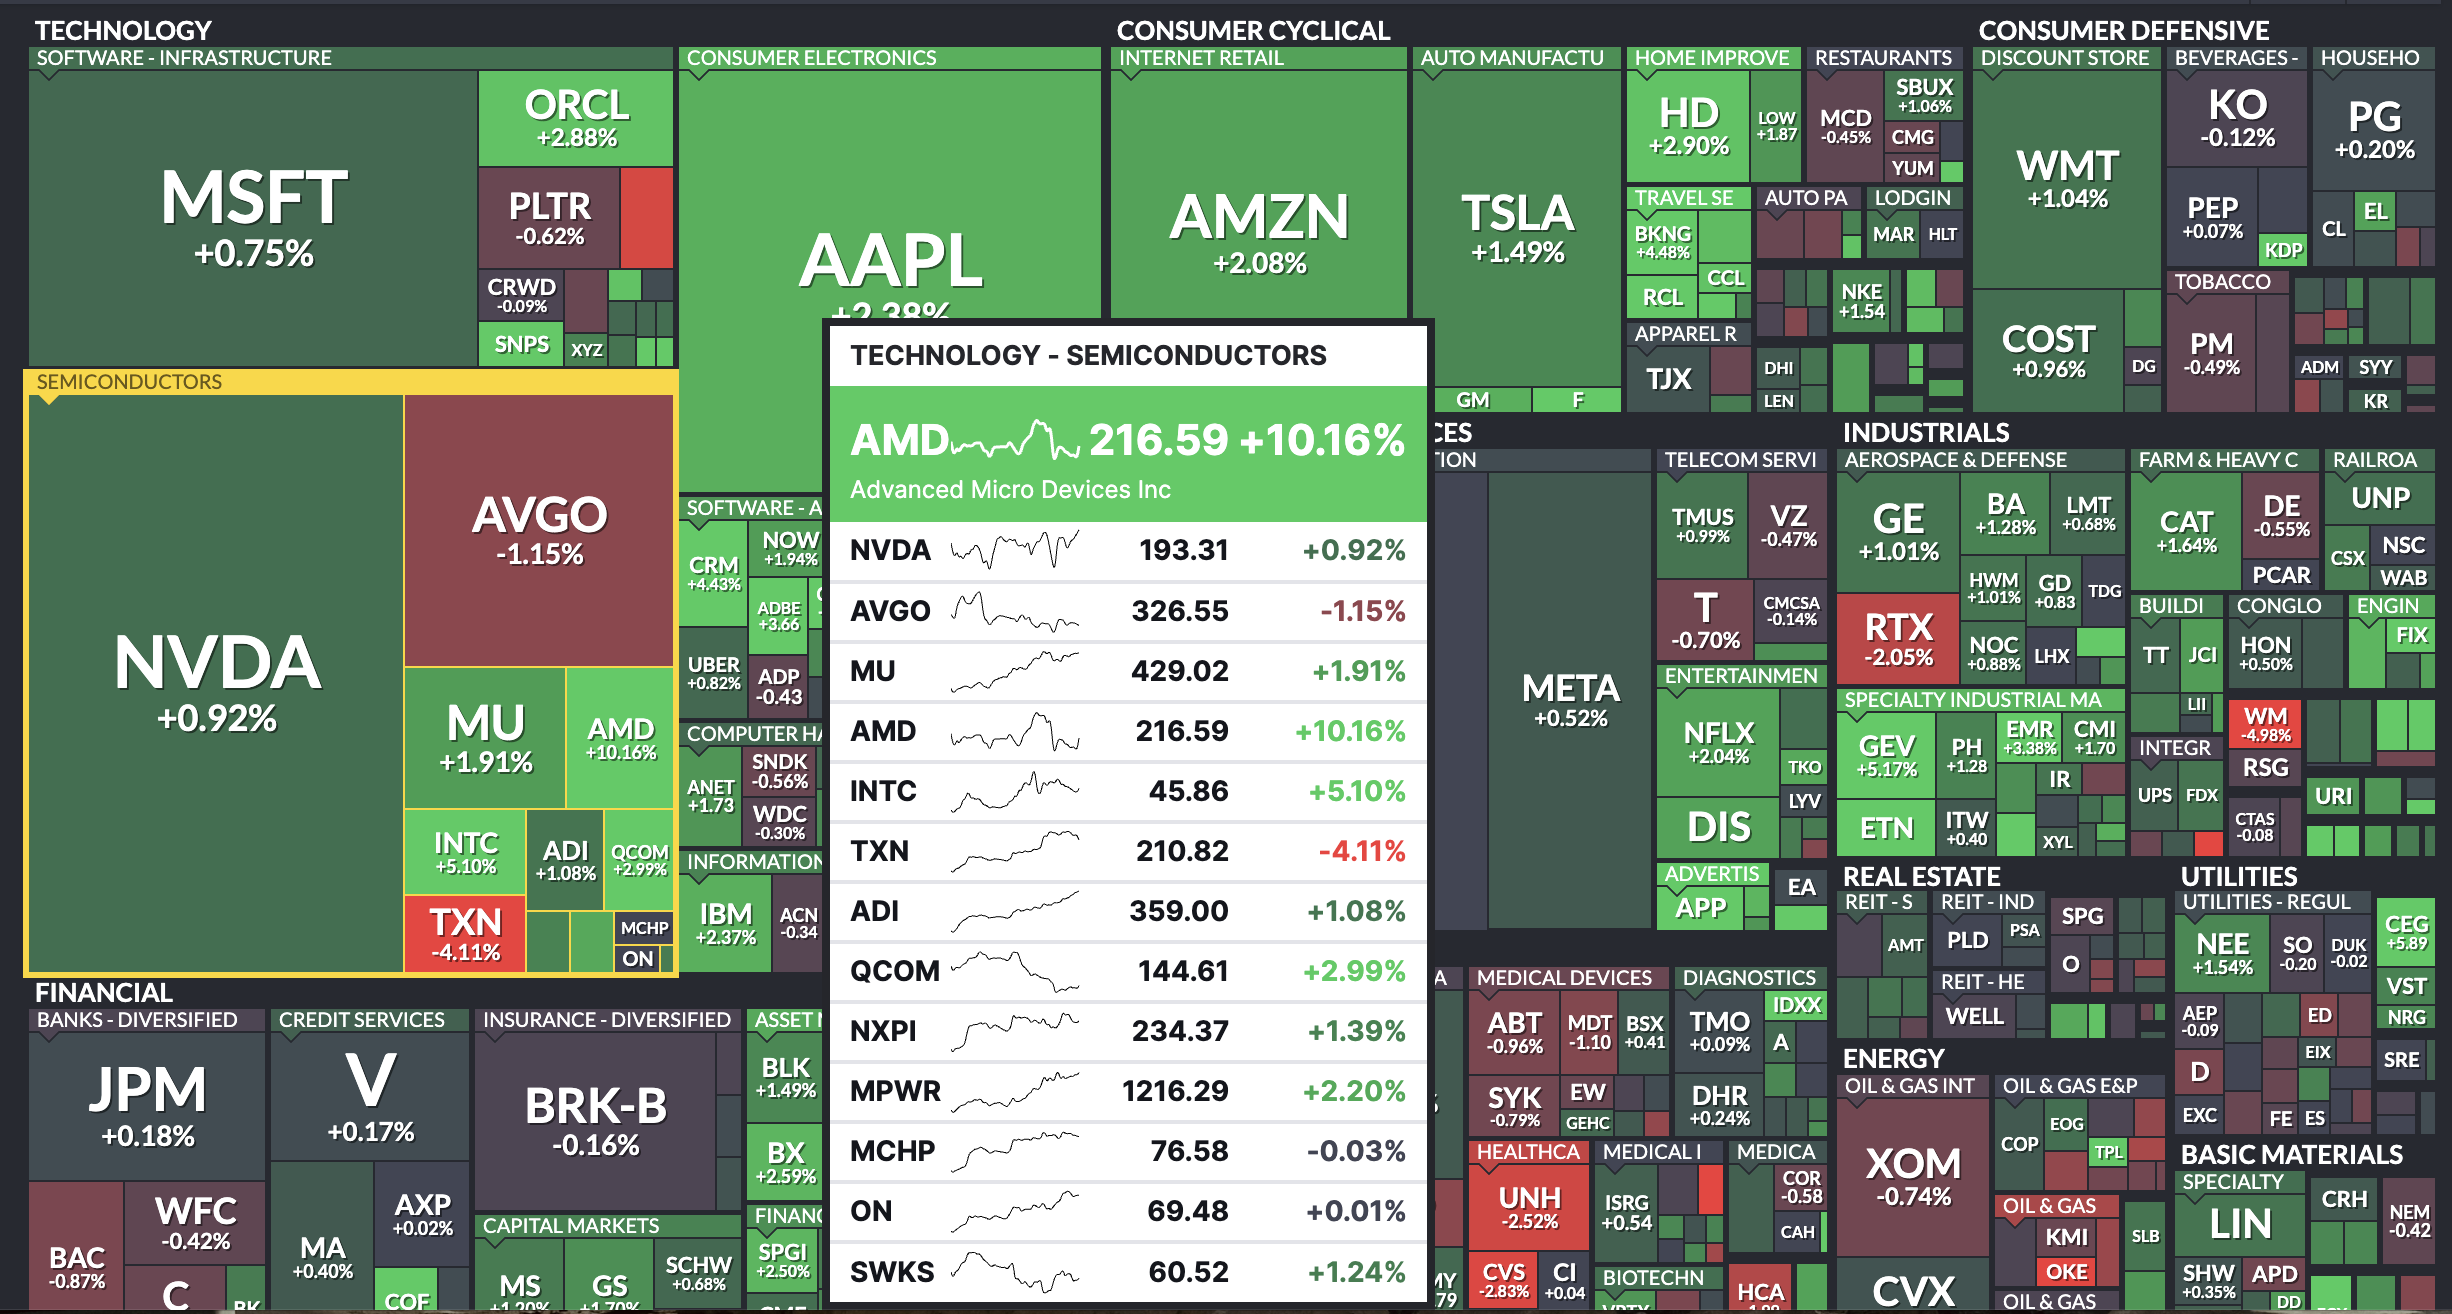
The Nasdaq leads gains at roughly 1%, confirming a big tech rebound, while the Dow is up around 400 points. AMD is surging over 10% on a blockbuster Meta AI chip deal, setting the tone for the session.
Top US Stock Market News:
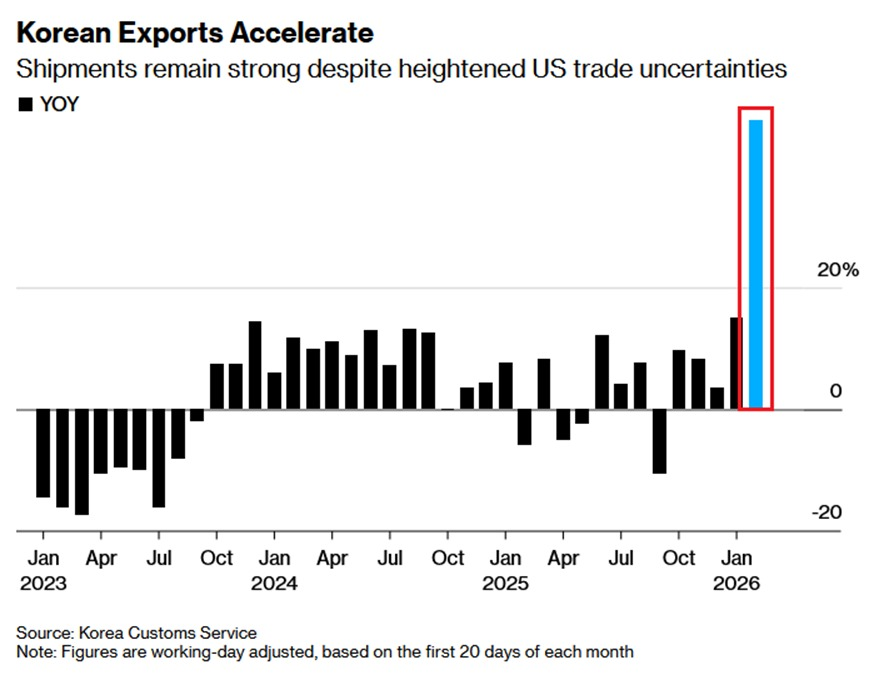
South Korea Exports Surge 47%, Gold Eases On Risk-On Shift: South Korea’s semiconductor exports jumped 134% YoY in early February. Shipments to the US are up 22%, China up 31%, and Taiwan up 76%.
For Wall Street, this confirms that US and global companies are actively scaling AI infrastructure at an accelerating pace. It is the same spending cycle driving today’s AMD-Meta deal. Meanwhile, gold dipped roughly 1% to around $5,150 as the equity rebound reduced safe-haven appetite.
New 10% Global Tariffs Take Effect, State Of The Union Tonight: Trump’s temporary tariffs under Section 122 (capped at 150 days) went live at 10%, lower than the feared 15%, with some exemptions.
Markets are treating it as manageable for now. However, the State of the Union address tonight (after market close at 9 PM ET) is the wildcard — any hawkish escalation on trade policy could reverse today’s relief bounce when markets reopen tomorrow.
Tech-Led Relief Rally Lifts Wall Street
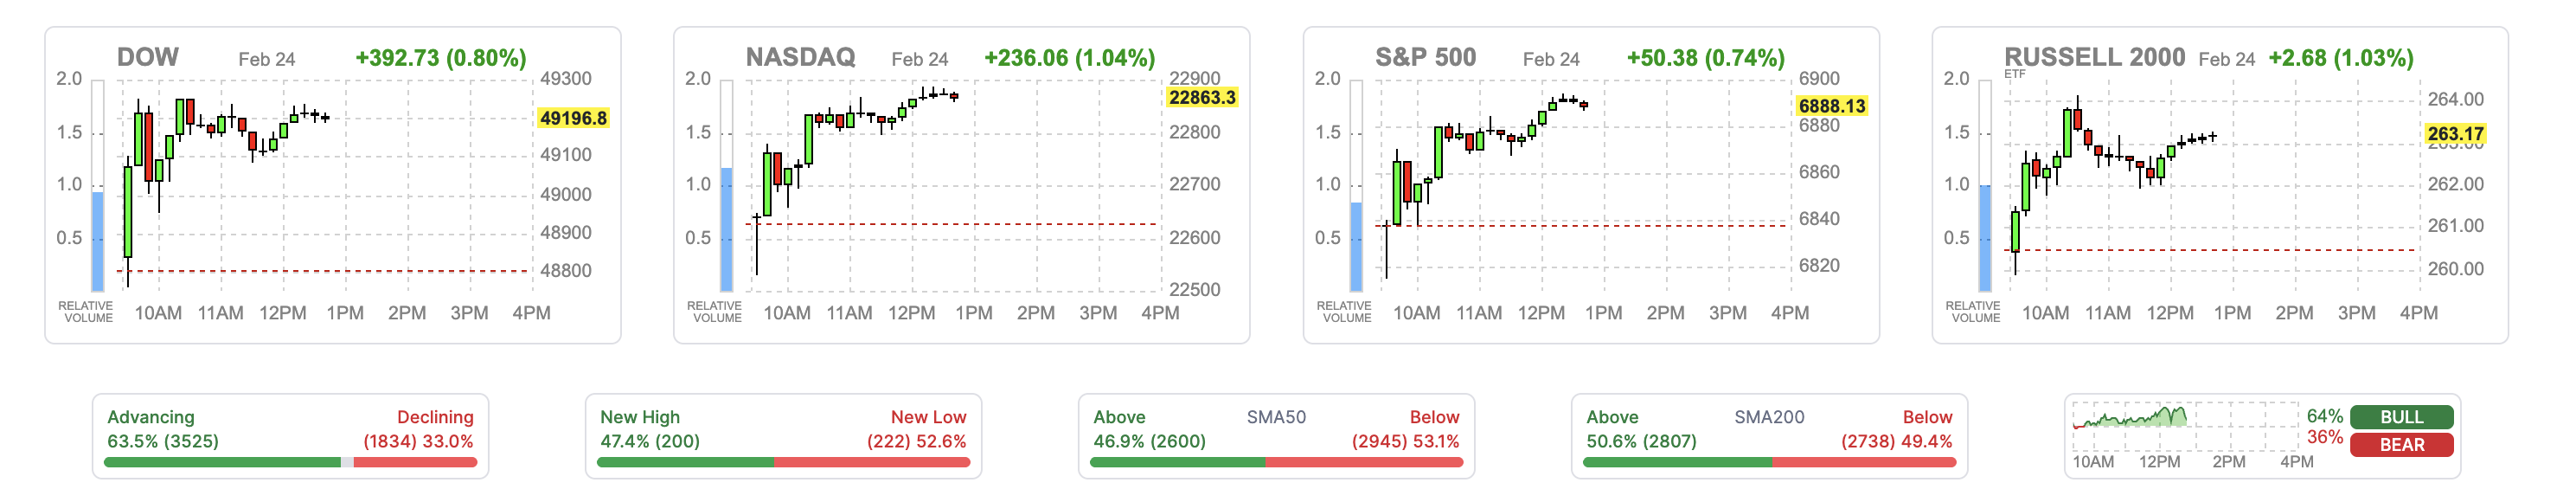
Wall Street is staging a broad-based recovery on February 24, 2026, with 63.5% of stocks advancing against just 33% declining. The S&P 500 is trading around 6,890 at press time, up 0.7% from Monday’s close — clawing back a chunk of yesterday’s AI-driven selloff.
The Nasdaq Composite is leading at 22,863, up approximately 1.2%, confirming that technology is driving this rebound. When the Nasdaq outpaces both the S&P 500 and the Dow, it signals that risk appetite is returning.
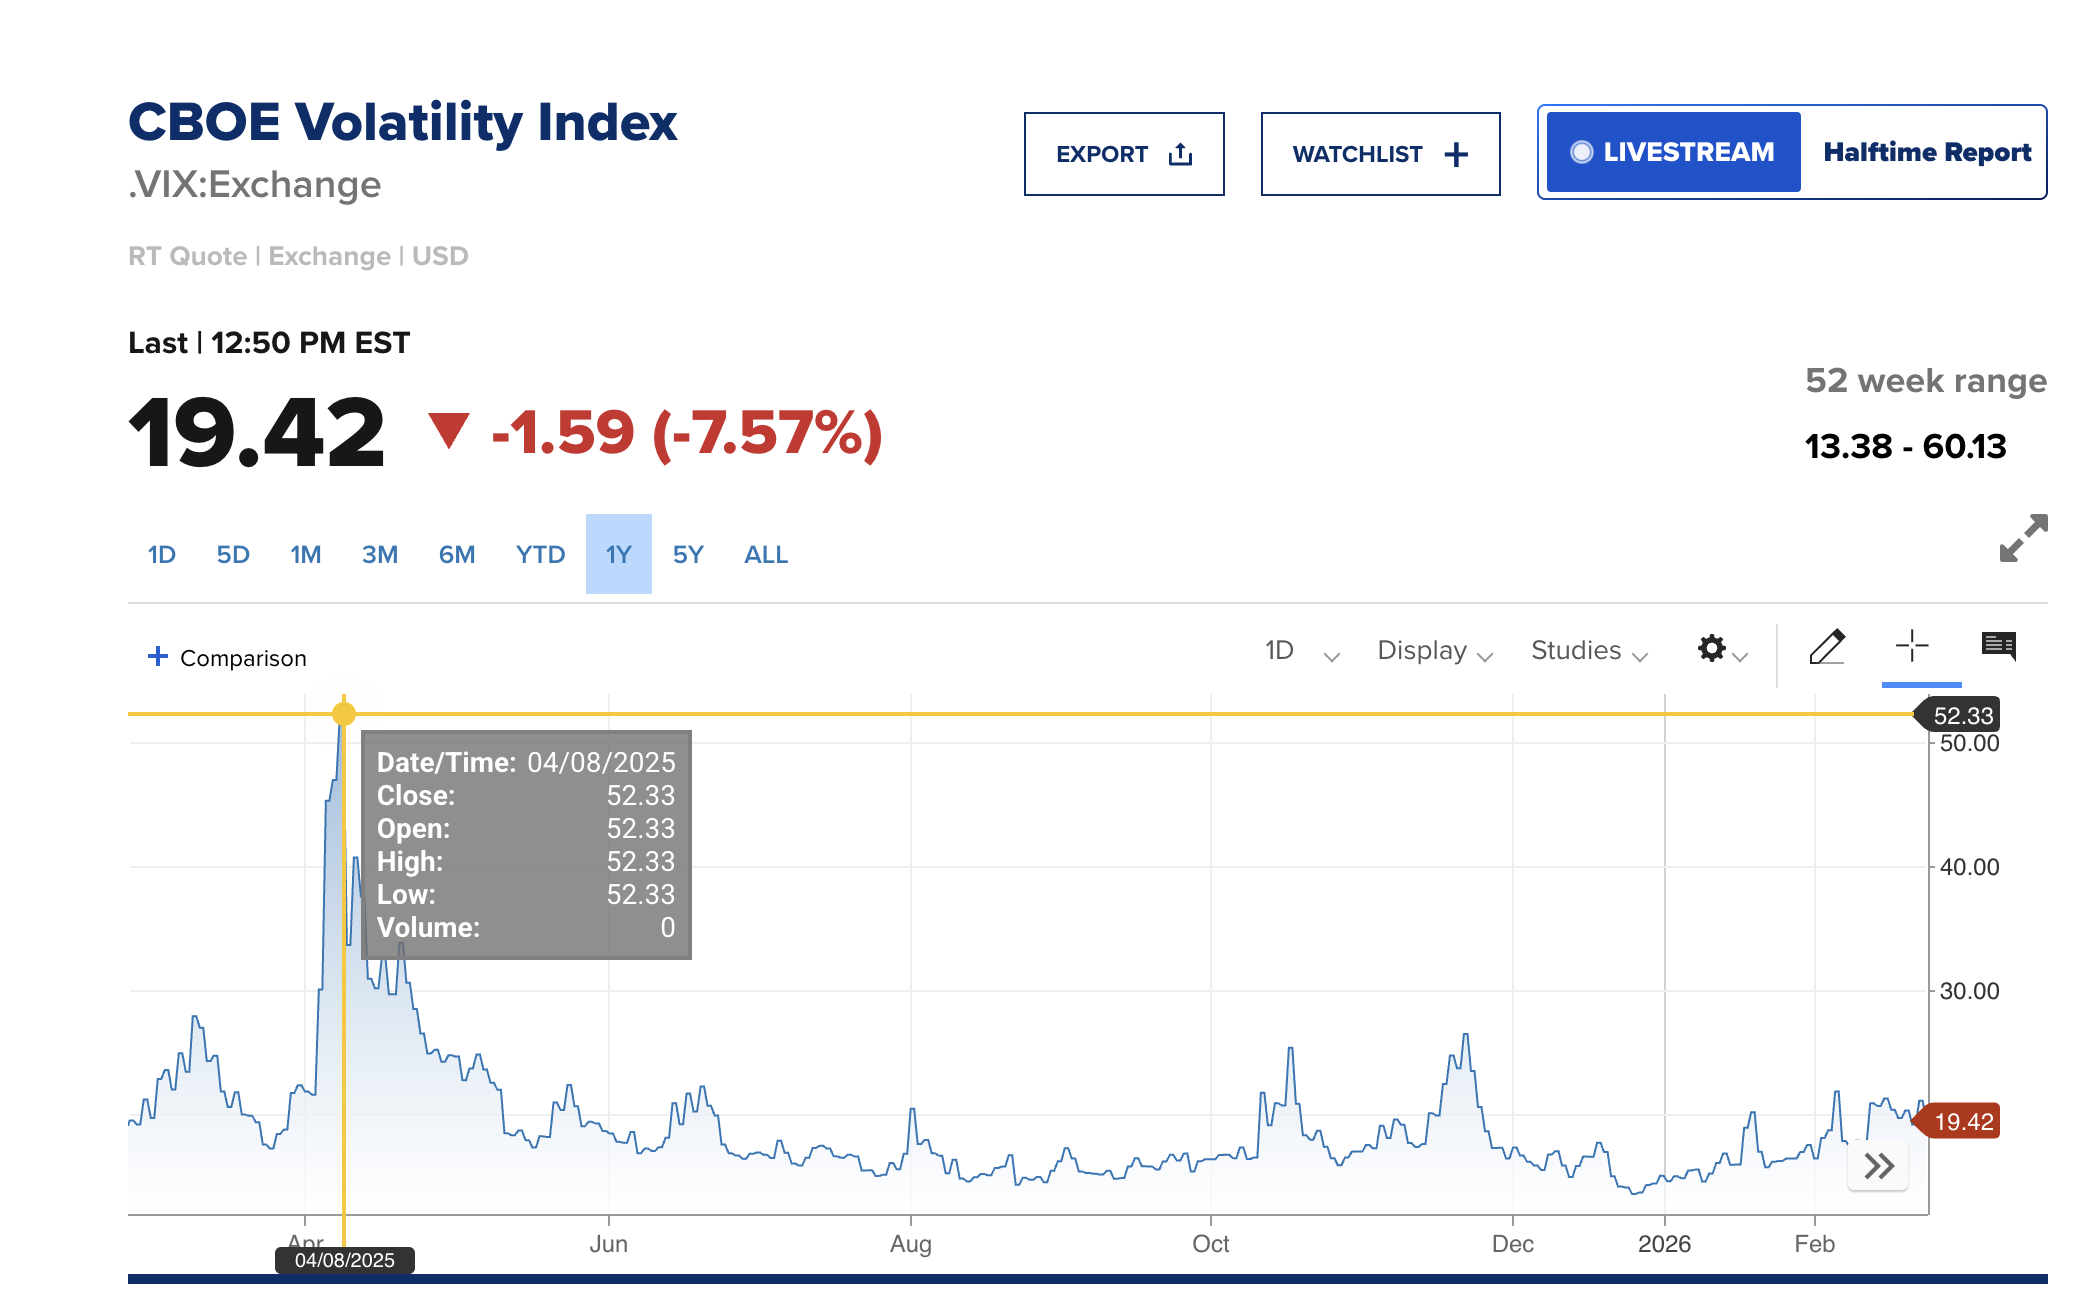
The CBOE Volatility Index (VIX) dropped 7.5% to 19.39, pulling back below 20 for the first time since Monday’s panic. A VIX near 19 reflects cautious optimism, not complacency.
Major S&P 500 Risk Emerges
However, the S&P 500’s broader technical picture carries a warning. The index appears to be trading within a head-and-shoulders pattern, with key support at 6,770 — a level that held on February 17.
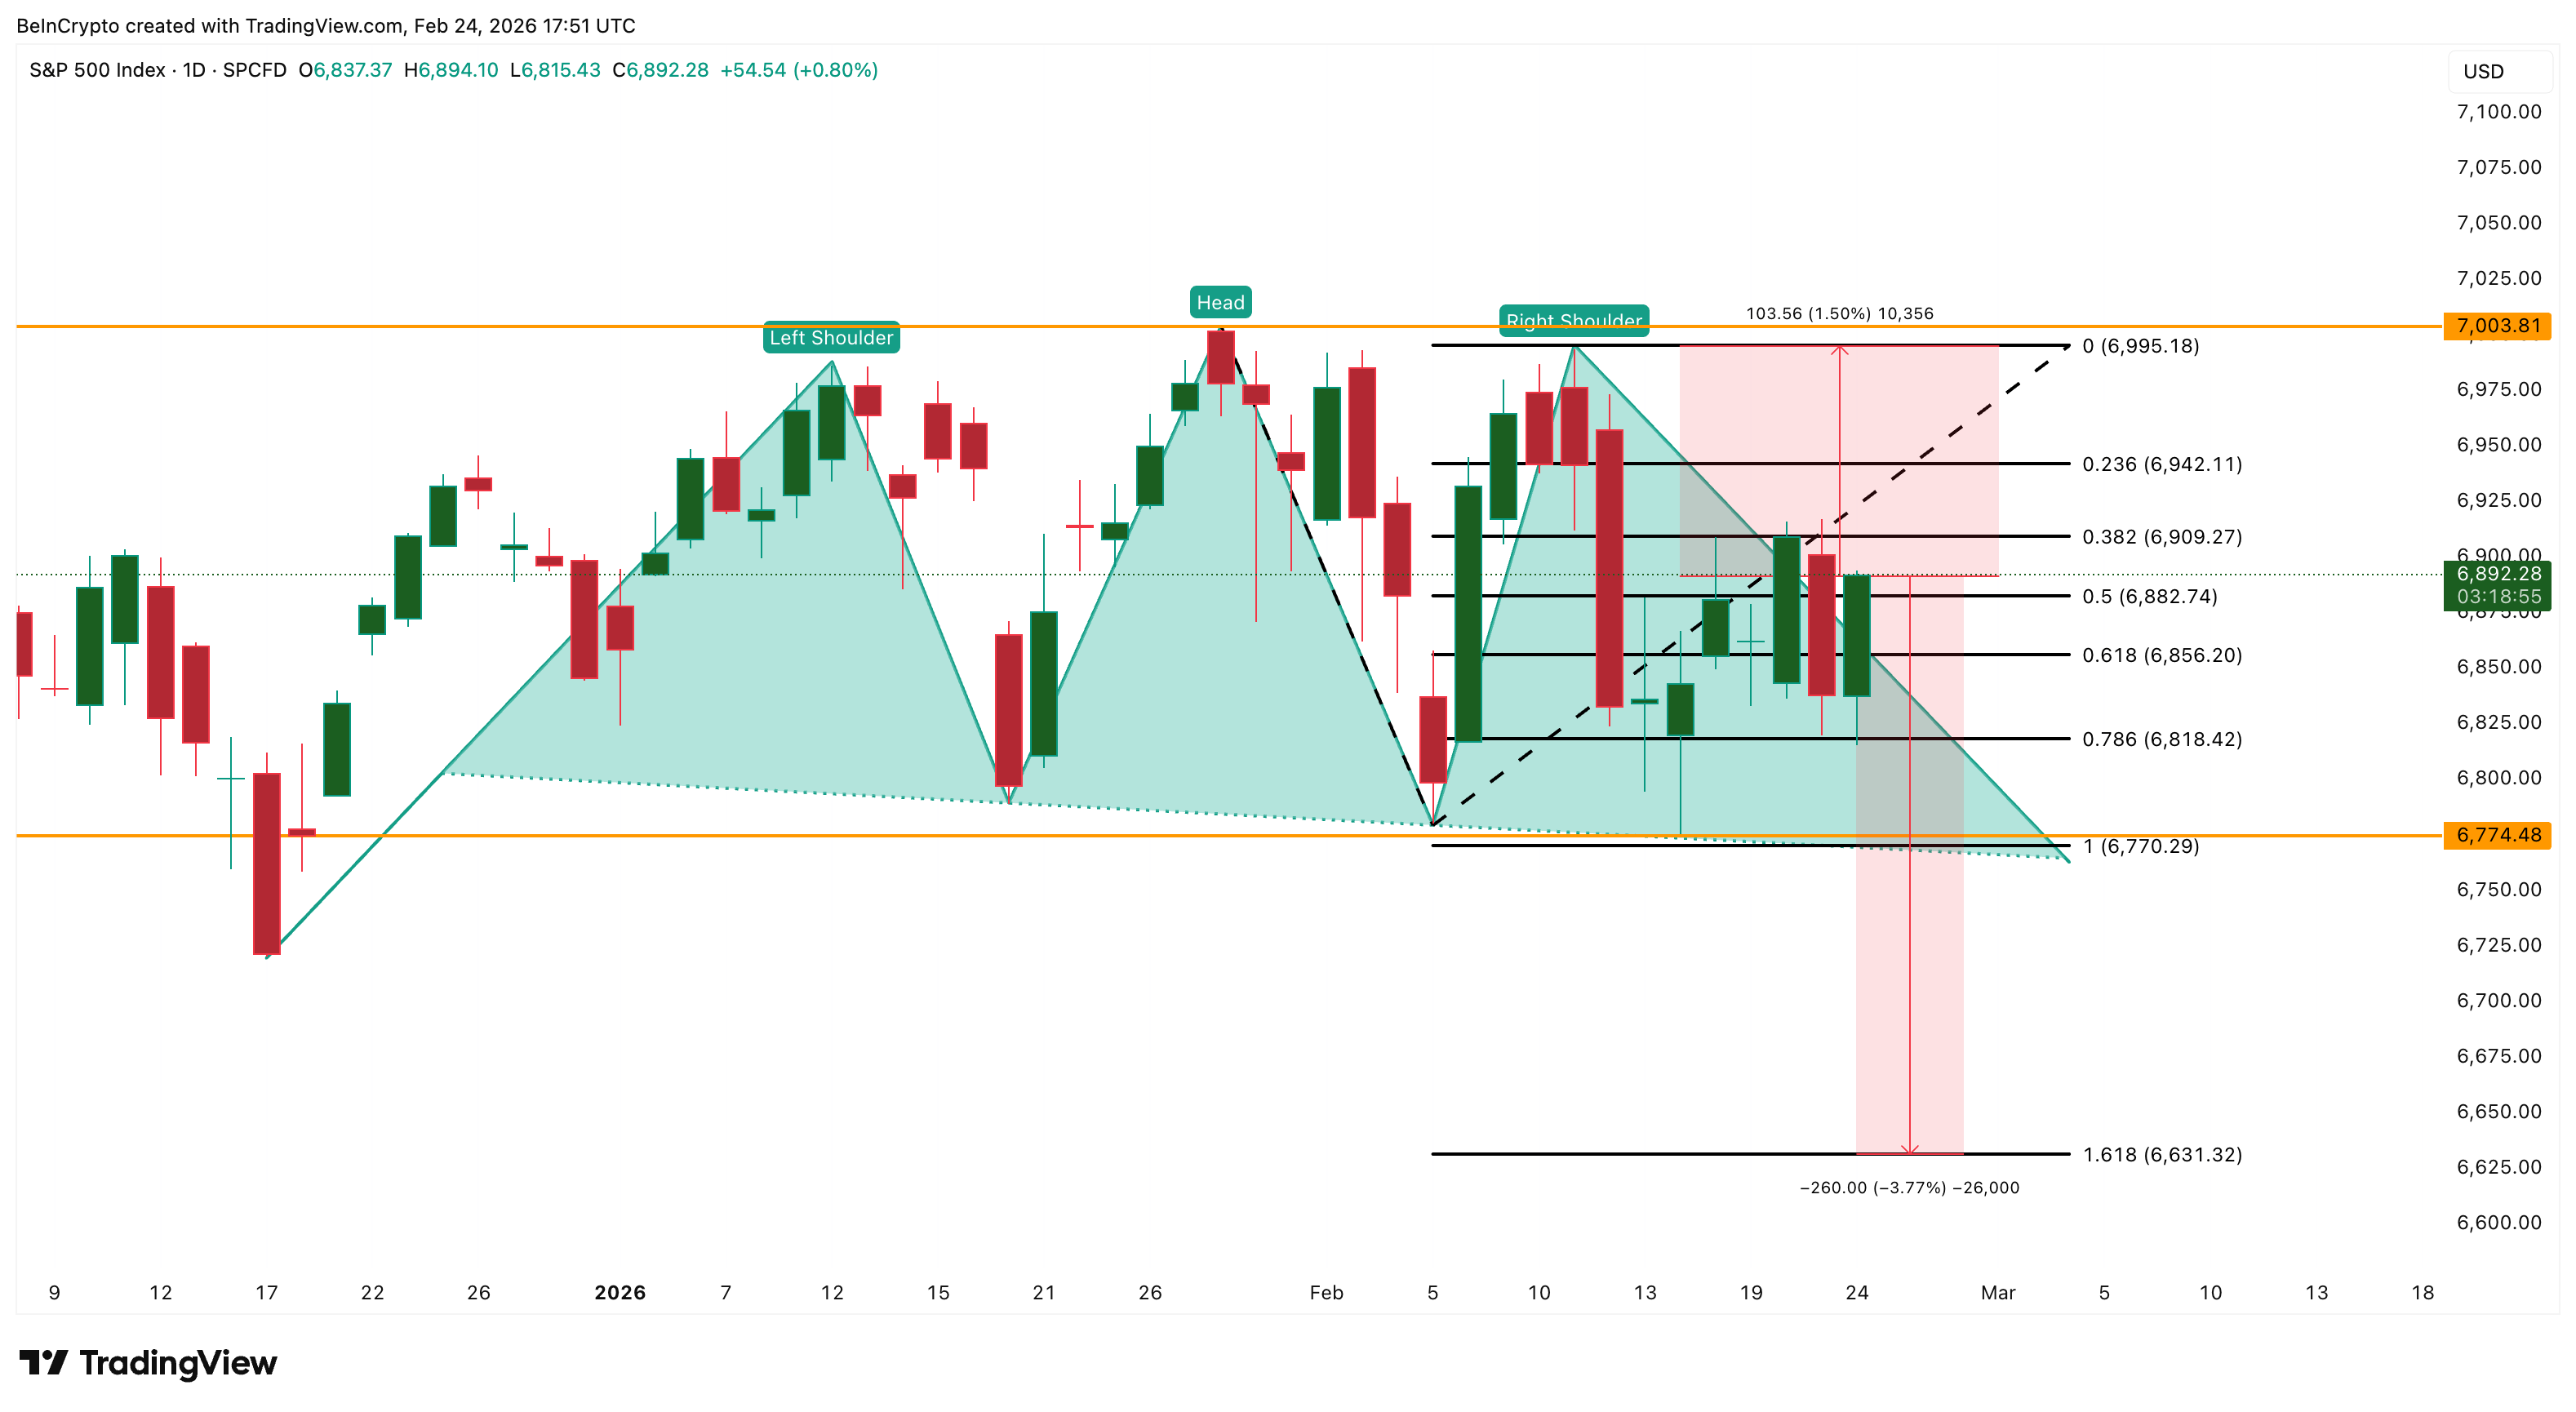
A daily close below 6,770 would activate the pattern and expose a potential drop toward 6,631, roughly a 3% decline from current levels. This level aligns with Fibonacci support, adding technical confluence.
That downside risk is not just a chart concern. Goldman Sachs recently flagged a US stock market correction as the biggest near-term threat to the US economy.
Economist Pierfrancesco Mei projects 2.5% GDP growth in 2026 but warns that a 10% market pullback could shave 0.5 percentage points off growth, while a 20% decline could cut nearly a full point.
With midterm election years historically averaging 19% intraday declines, the risk is not theoretical.
On the upside, a push above 6,995, a 1.5% move, would weaken the bearish head and shoulders structure. Tonight’s State of the Union address is critical. A tone focused on economic resilience and growth could extend this relief bounce into the week.
Tech Bounces While Energy Pauses
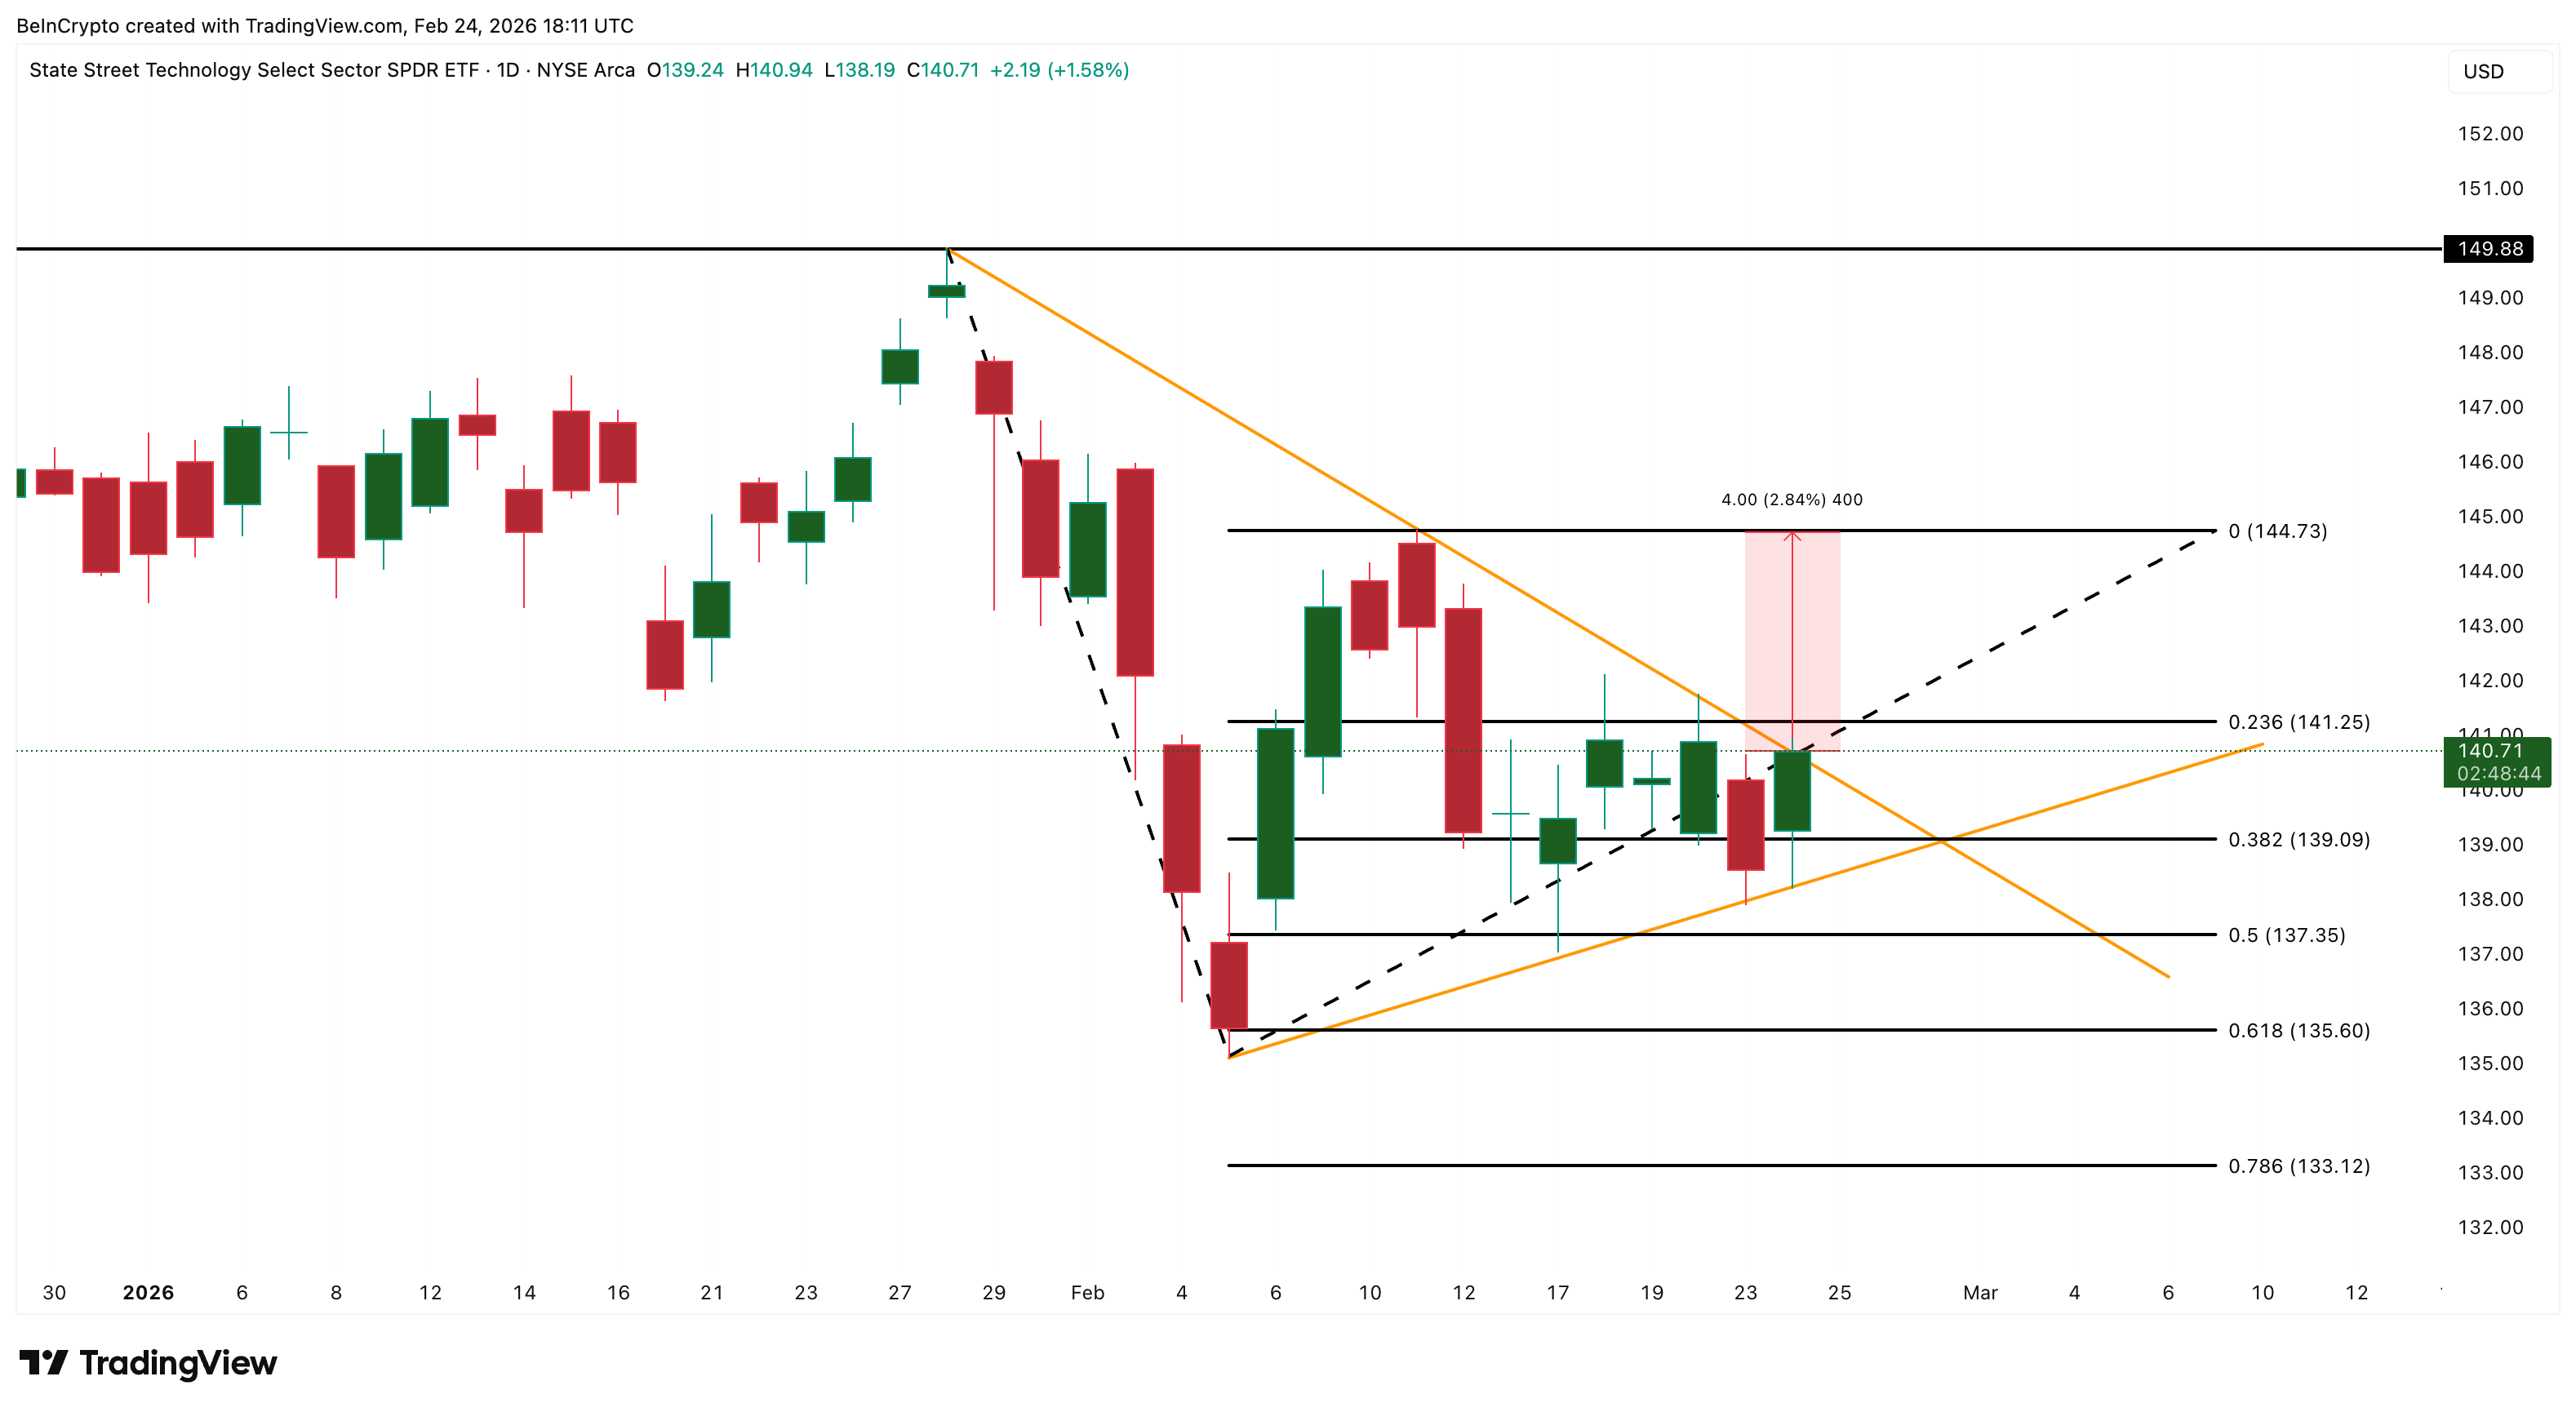
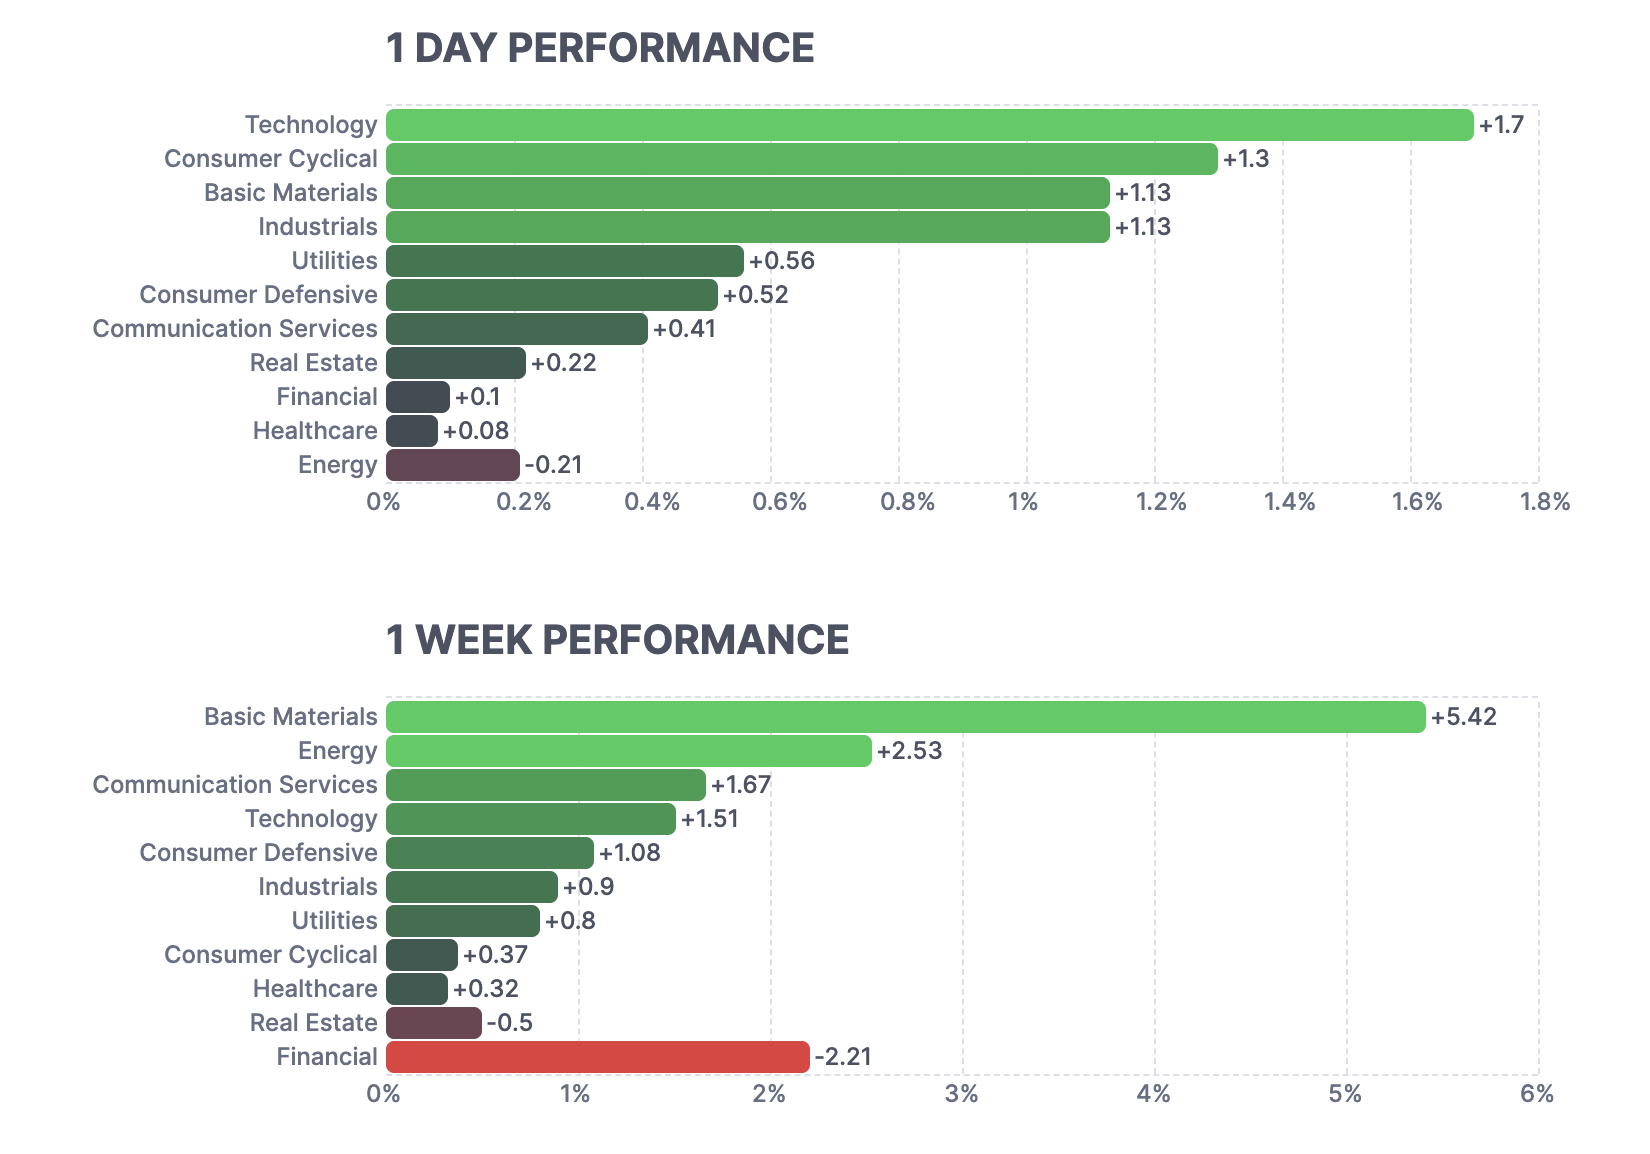
Technology (XLK) is the clear US stock market leader today, up 1.7% as the AMD-Meta AI deal and easing AI disruption fears trigger aggressive dip-buying after Monday’s selloff.
But the strength comes with a caveat — XLK is trading inside a symmetrical triangle, meaning it can break either way.
To regain bullish momentum, it needs a daily close above $144.73, roughly a 2.84% move from here. A break below $139 and $137 would crack the lower trendline and expose a drop toward $133. Today’s strength is a relief bounce within a range, not a confirmed trend reversal.
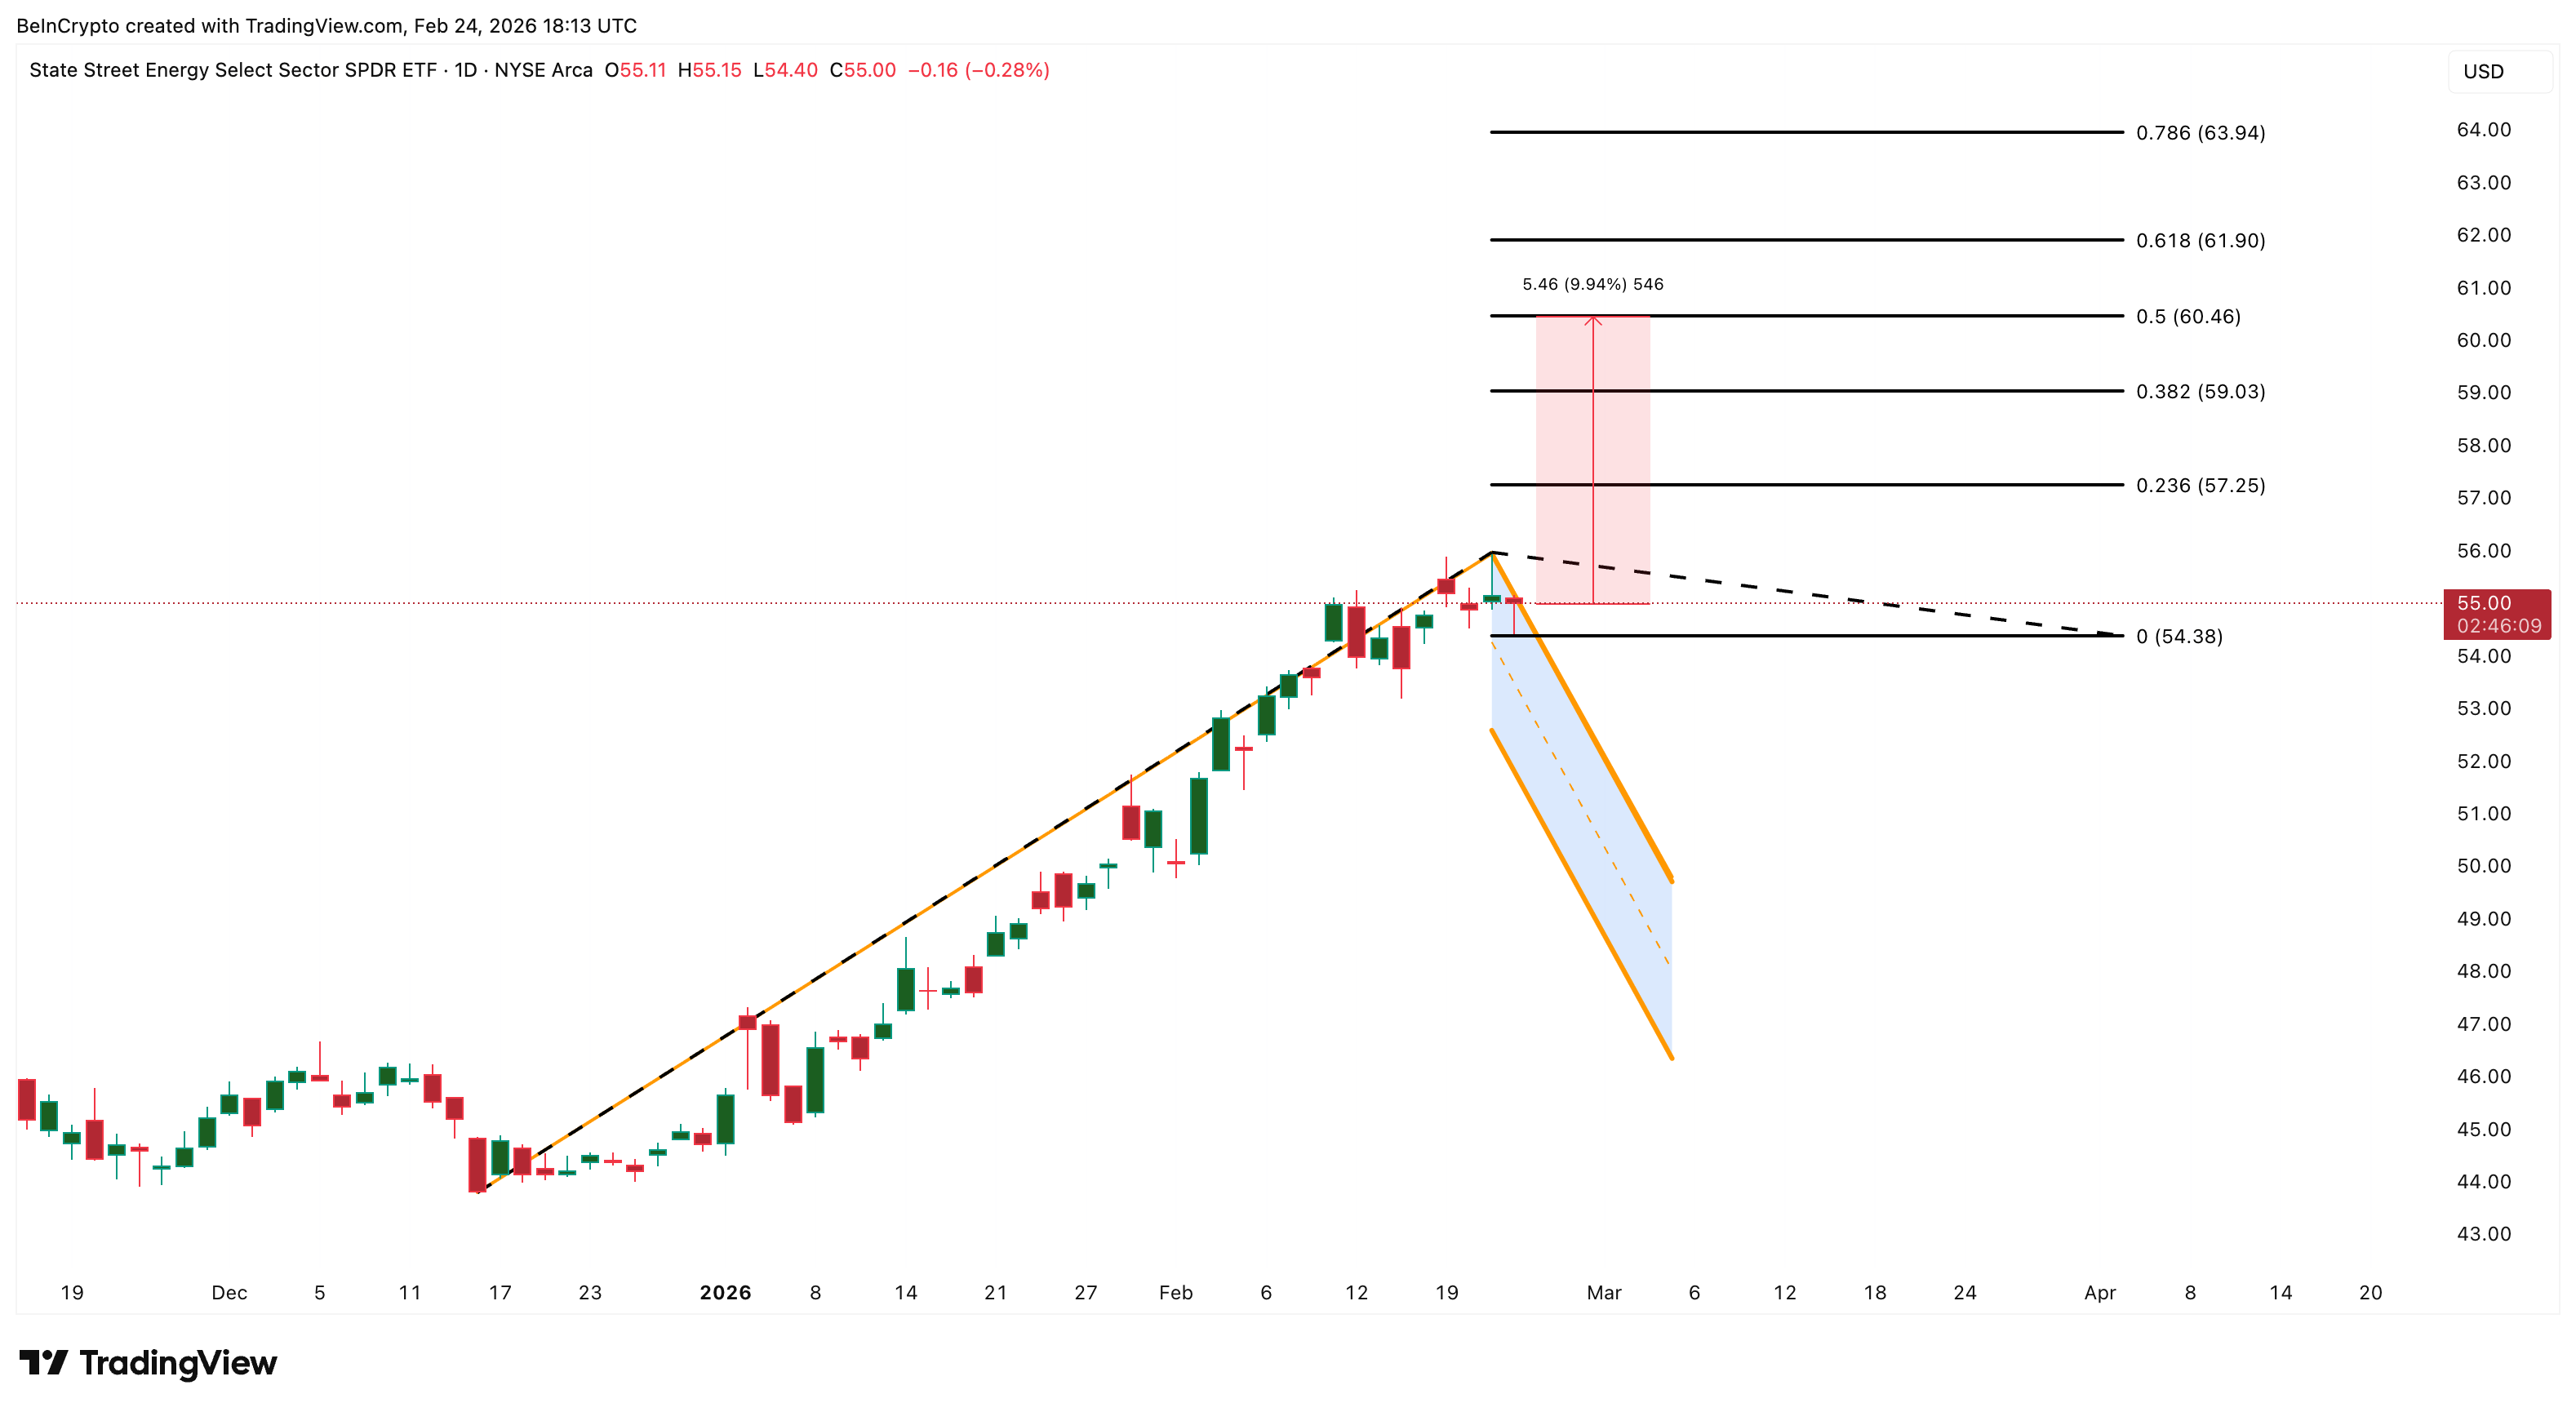
Energy (XLE) is the only sector in the red today at -0.21%, making it the session’s sole laggard. The weakness ties to profit-taking after a strong weekly run — XLE is still up 2.53% on the week, second only to Basic Materials’ (XLB) massive 5.42% surge.
Despite today’s dip, XLE continues to trade inside a bull flag pattern that has been building since mid-December.
As long as $54.38 holds, the structure remains intact with a potential move toward $60 and even $63 in the medium term — roughly 10% upside from current levels.
The weekly picture reveals the real rotation. Basic Materials (XLB) is dominating at +5.42%, driven by commodity demand (copper, for instance) from AI infrastructure buildout and tangible asset preference.
Financials (XLF) remain the biggest weekly loser at -2.21%, still reeling from tariff concerns that today’s mild +0.1% barely dents.
AMD, with 2.85% XLK (tech) weighting, has been the recurring theme throughout today’s session.
Now the details: shares are up over 10% at $216, fueled by a multi-year partnership with Meta worth an estimated $60–$100 billion to supply Instinct GPUs for Meta’s AI data centers, starting late 2026.
Meta also receives a warrant for up to 10% equity stake in AMD, vesting on milestones and stock price targets up to $600. The implications extend beyond AMD. The deal confirms AI infrastructure spending is accelerating, and directly counters Monday’s AI disruption fears with real capital commitment.
But the chart urges caution. AMD is trading within a double top structure with twin peaks near the $237–$267 zone. The neckline projection points to a potential 27% decline toward $142 if the pattern confirms.
A break below $193 activates the full measured move. To invalidate the bearishness, AMD needs to reclaim $240 and eventually push above $267.
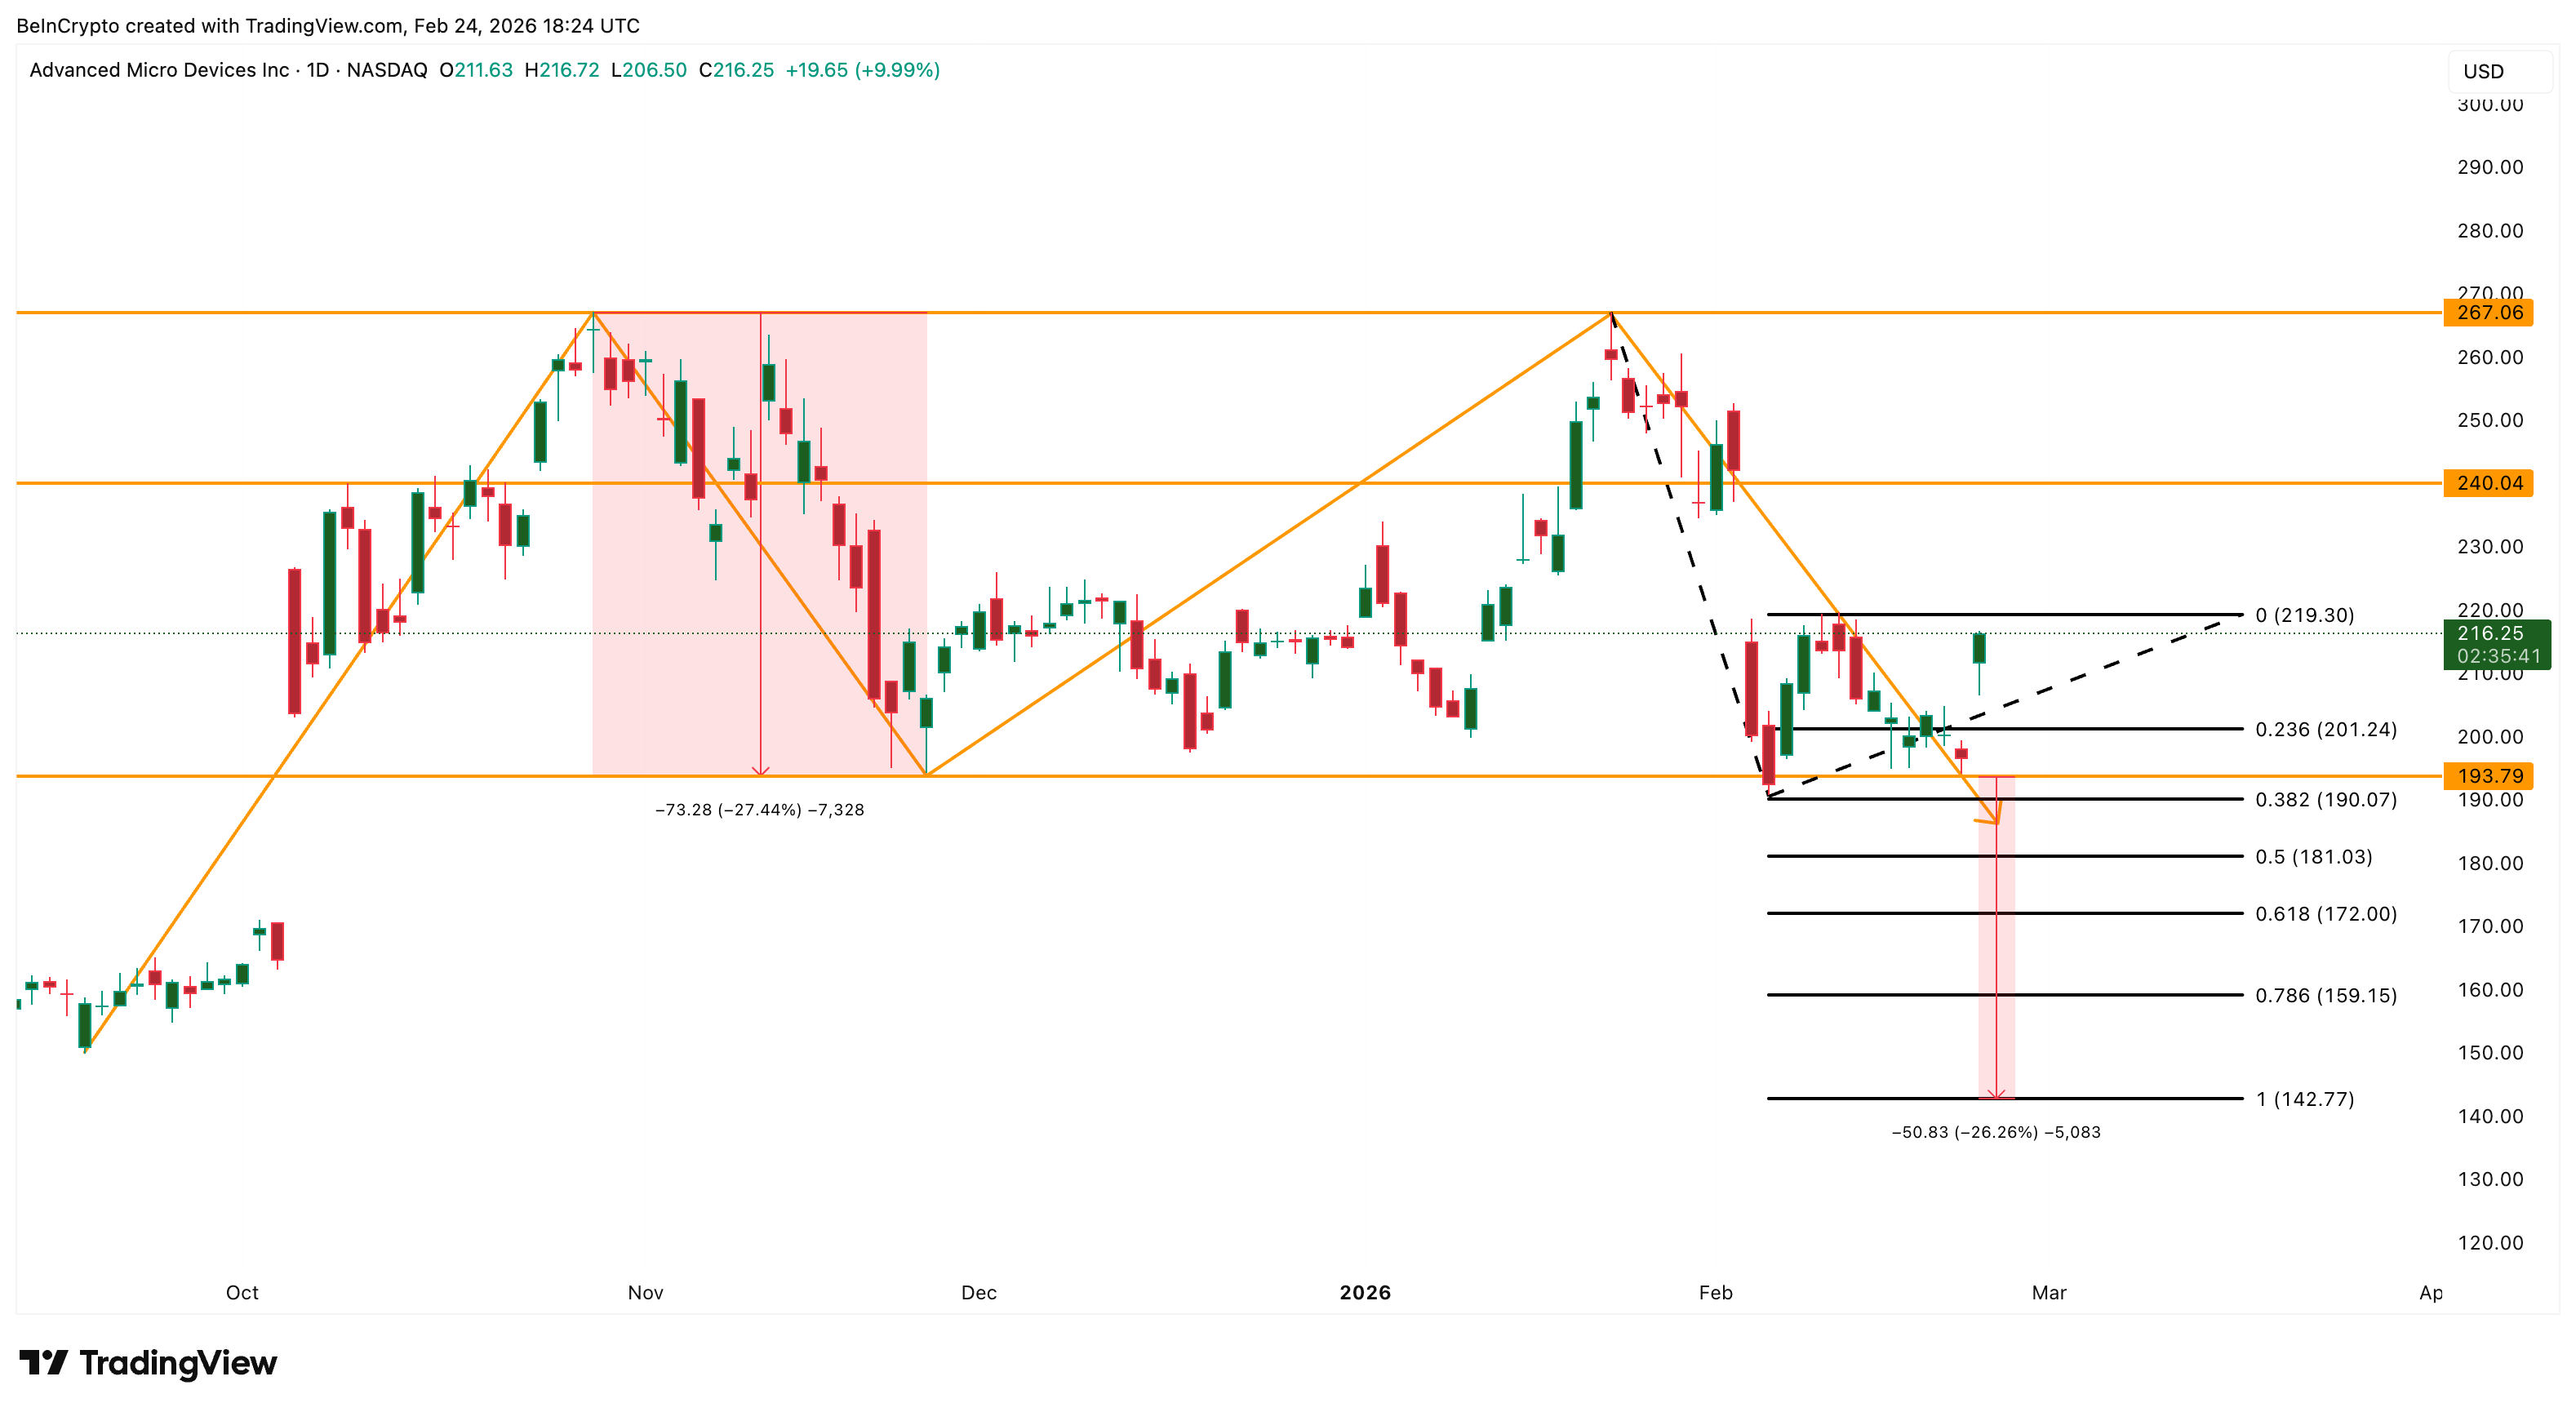
Today’s 10% surge is impressive, but it keeps the double top intact rather than breaking it. With Nvidia earnings due this week, a strong print could validate the AI cycle.
But it could also remind the US stock market of Nvidia’s dominance. That could cap AMD’s momentum. A weak Nvidia result could drag the entire semiconductor space lower regardless of the Meta deal.

Be the first to comment